MANUFACTURING WINTER WITH GEOENGINEERING

GEOENGINEERING WATCH
Dane Wigington
geoengineeringwatch.org
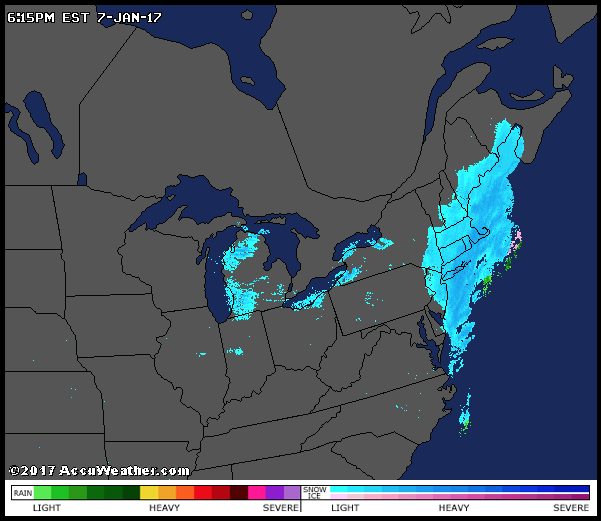
In the combination satellite/radar image below, two flows of moisture (one in the west, one in the east) are being orchestrated and utilized by the climate engineers in the attempt to cool large regions of the US with chemical ice nucleation processes. The “Pineapple Express” of warm air and moisture is flowing in from the Pacific in the west. This flow of warm moisture was the beginning of “Winter Storm Iras“. In the East, an anomalous flow of warm air and moisture from the warm waters southeast of Florida is pushed up the eastern seaboard, this warm flow was the fuel for the final chapter of “Winter Storm Helena“.

How can such warm sources of moisture “change over” to snow and cold? Welcome to climate engineering and chemical ice nucleation.
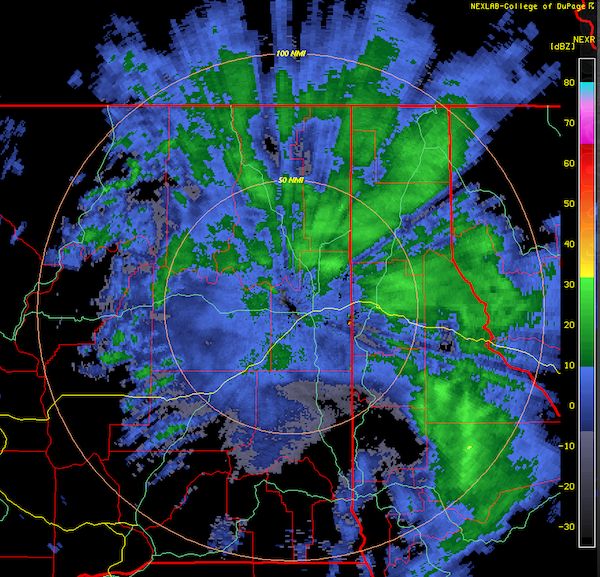
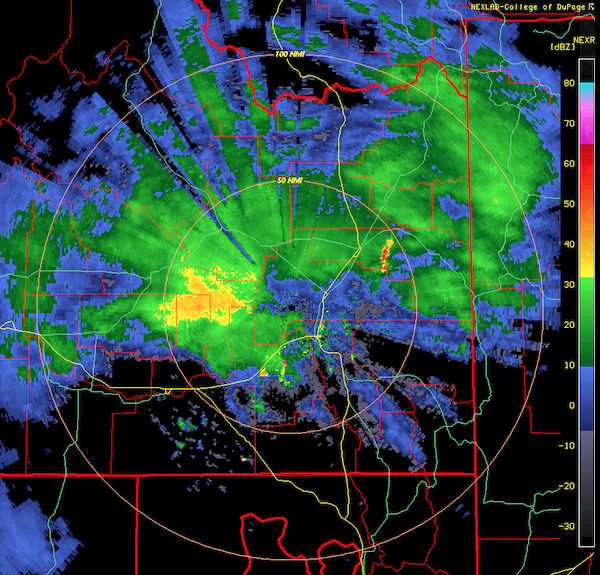
The radar map below was captured at the same approximate time as the combination satellite/radar image above. When comparing these two images, the following question should be considered: how does a warm flow of air and moisture originating from warm oceans south of Cuba suddenly “change over to snow”? The “change over to snow” term is now commonly used by power structure owned “The Weather Channel” paid actors (and other power structure owned sources of weather “forecasting”).
Looking closely at the above radar map, some rain cells (unfrozen precipitation) are still visible near the eastern fringes of the chemically nucleated snow zones.
The next combination satellite/radar map below was taken approximately 20 hours after the similar image shown earlier in this article. The flow of warm moisture from south of Cuba to Maine and beyond was still fueling “Winter Storm Helena”. In the west, the “Pineapple Express” was ramping up to fuel “Winter Storm Iras”.

As the ongoing global climate engineering assault continues to be ramped up, satellite and radar images are becoming increasingly bizarre. Note that in the image above the entire North American continent is completely covered with a canopy of clouds and atmospheric aerosols. The same is true of mainland Mexico and almost all of the Gulf of Mexico. This is “solar radiation management” in action.
The satellite map below must be compared with the satellite/radar map directly above. As already stated, the warm flow of moisture being utilized for “Winter Storm Iras” is flowing in from the warm Pacific. Consider that there is virtually no snow of frozen precipitation visible in California, even in extremely high mountain locations with elevations well over 10,000 feet. Why not? Because of the very warm sources of this moisture. The day before the image below was captured, it snowed at the valley floor in Redding, California. Redding is at an elevation that is just above sea level at 500 feet. Then, the next day, as shown in the image below, no snow anywhere in the state including at elevations of far over 10,000 feet.

A final note on the map above to consider, snow is shown falling in southern Mississippi, and only rain at the top of the Sierra Nevada mountain range. What is wrong with this picture?
The short satellite animation below was taken approximately 8 hours after the radar image directly above. The beginning of chemical ice nucleation processes were beginning to appear in California at the top of the Sierra Nevada mountain range. Further inland, the warm flow of rain can be seen “changing over” to snow. As the chemical nucleation assault unfolds, the temperatures on the ground level can and do cool dramatically as a cold dense layer of air is created.
Also of note in the animation above, the impact of powerful radio frequency/microwave transmissions (used for climate modification) can clearly be seen in parts of Idaho and Washington.
The close up screen shot below is of a radio frequency transmission source in Washington, taken at the same time as the animation above was recorded.
The RF transmissions are a primary component of the ongoing climate modification processes.
The next close up screen shot below, taken over an Idaho RF transmission source, was also captured at the same time as the animation shown earlier.
The RF/microwave transmissions are just one more catastrophically harmful aspect of geoengineering programs.
The next two NOAA extended “forecast” (scheduled weather) maps below reveal what is coming for the US, yet more extreme weather whiplash. The chemical cool-downs cannot be kept up indefinitely, the record warmth will again re-appear in the south and East.
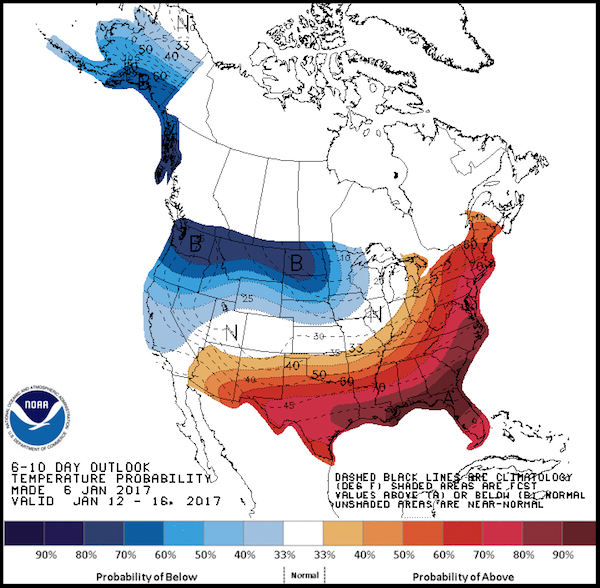
Every engineered cool-down that is carried out by the climate engineers comes at the cost of an even worse overall planetary warming.
The next extended forecast map below clearly shows a continued expansion of the extremely rapid rebound of warmth for the US. This extended “forecast” map also clearly shows where the climate engineers plan on focusing their efforts next, Alaska (along with continueing massive operations in Europe). The 48 of the US are headed back toward record heat as the geoengineers will do all they can to chemically cool the Arctic in their ever more desperate attempt to hide the implosion of the ice at the poles. The climate engineering chemical cool-downs are used to temporarily (and toxically) mask the ongoing planetary meltdown. 2016 was yet another record shattering warm year on planet Earth.
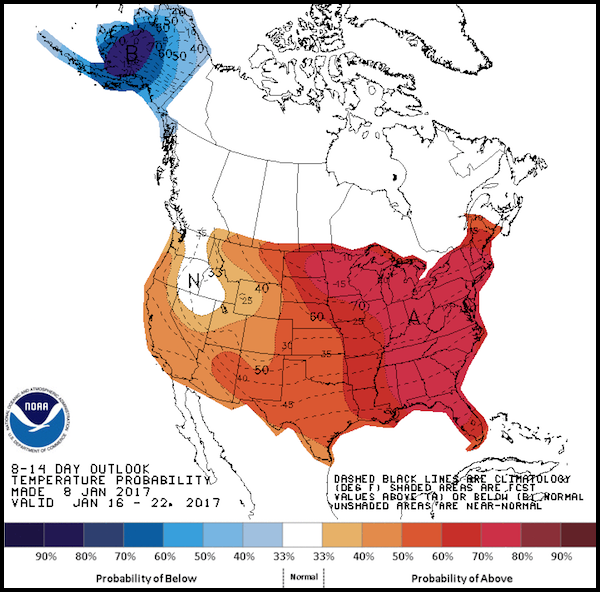
Radical weather whiplash scenarios will continue to rapidly worsen.
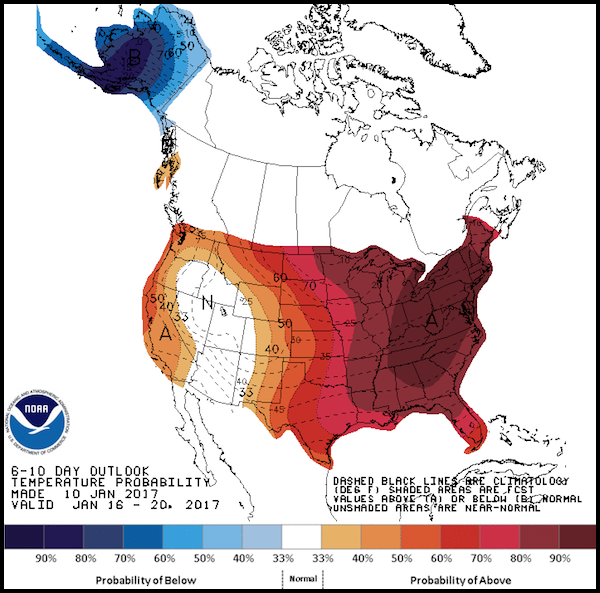
The final NOAA extended “forecast” map indecates that record breaking high temperatures will rapidly replace the preceeding climate engineering chemical cool-downs.
We must expose and halt the ongoing climate engineering insanity, this is not an option, but an absolute imperative. Make your voice heard in this epic battle to salvage what is yet left of Earth’s life support systems.
DW
May be freely reprinted, so long as the text is unaltered, all hyperlinks are left intact, and credit for the article is prominently given to GeoengineeringWatch.org and the article’s author with a hyperlink back to the original story.


Replies
GeoEngineering is out of order since it's playing with nature ..harming nature ..harming the Planet ...harming the inhabitants.
SHOULD LET NATURE TAKE ITS COURSE